East-west roof for solar: yield compared with south
An east-west roof yields about 20 % less per kilowatt than south. It is still often the better system: more roof area, a flatter daily curve, higher self-consumption. The figures for seven Austrian cities.
Yield per kWp by orientation
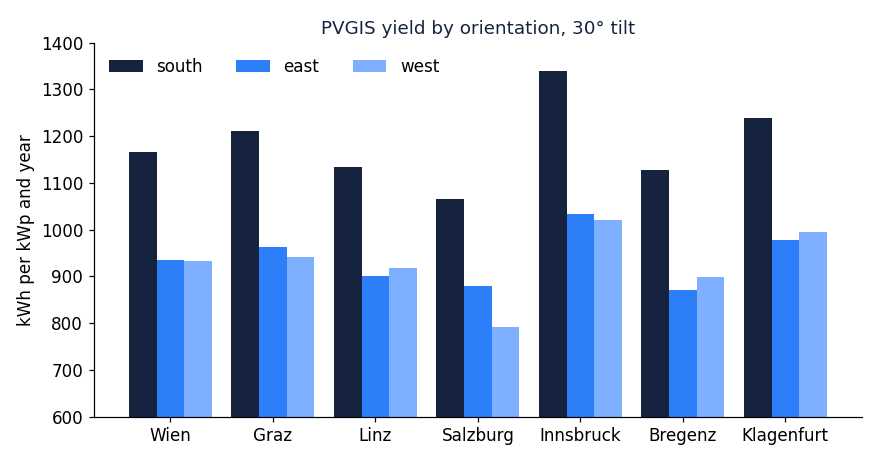
PVGIS 5.3, 30° tilt, system loss 14 %, kWh per kWp and year, with the terrain horizon of each place:
| City | South | East | West | East-West average | E-W vs. south | South-east | South-west |
|---|---|---|---|---|---|---|---|
| Wien | 1 166 | 935 | 932 | 934 | 80 % | 1 101 | 1 098 |
| Graz | 1 211 | 964 | 942 | 953 | 79 % | 1 143 | 1 128 |
| Linz | 1 134 | 900 | 919 | 910 | 80 % | 1 061 | 1 077 |
| Salzburg | 1 065 | 880 | 792 | 836 | 78 % | 1 033 | 959 |
| Innsbruck | 1 340 | 1 034 | 1 020 | 1 027 | 77 % | 1 249 | 1 247 |
| Bregenz | 1 128 | 872 | 898 | 885 | 78 % | 1 043 | 1 070 |
| Klagenfurt | 1 240 | 978 | 994 | 986 | 80 % | 1 159 | 1 173 |
East-west lies between 77 and 82 % of south. South-east and south-west lose only 4 to 8 %, the often overlooked middle ground: a roof turned by 45° is almost as good as south. Salzburg west stands out because the terrain horizon there takes the evening sun earlier.
Why east-west wins anyway
- Double the area. On a gable roof with an east-west ridge both sides are free. 16 modules instead of 8 yield more than 8 south modules, even at 20 % less per module.
- Flatter daily curve. South delivers a peak at noon, east-west delivers from 8 am to 6 pm. Households consume in the morning and evening, not at noon. In PV-Schatten's self-consumption simulation the self-consumption rate with east-west typically rises by 5 to 10 percentage points compared with south, at equal system size.
- Less curtailment. Grid operators often cap feed-in at 60 or 70 % of module power. East-west reaches the peak less often and so loses less to the cap.
- Smaller inverter. Both roof sides share one inverter with two MPP inputs, which can be sized smaller.
When south remains better
With full feed-in and no self-consumption only the kilowatt-hour counts, then south wins. With a heat pump and buffer tank charging at noon, too. And with a limited budget for a few modules: the first 8 modules belong on the south side if the area exists.
Shading hits east-west differently
A tree to the south-west disturbs a south roof in the afternoon and a west roof all afternoon. A house to the east takes the morning sun from the east roof and hardly anything from the south roof. So calculate each roof side as its own PV area: PV-Schatten supports several areas per project and computes the horizon for each one.