PVGIS guide: calculate yield and account for shading properly
PVGIS is the free yield tool of the European Commission and the basis of almost every quote. It knows the irradiance since 2005 for every point in Europe. What it does not know are trees and houses.
What PVGIS is
The EU's Joint Research Centre has run PVGIS (Photovoltaic Geographical Information System) since 2001. Version 5.3 uses satellite data (SARAH3) from 2005 to 2023 at 5 km resolution, a 90 m terrain model for the horizon, and a model for temperature and module behaviour. Use is free, the data is CC BY 4.0.
Step by step
- Location: type an address or click the map. PVGIS takes latitude, longitude and altitude.
- Technology: “Crystalline silicon” for practically all current modules.
- Installed peak power: kWp of the system, e.g. 8.
- System loss: default 14 %. Covers inverter, cables, soiling, ageing. For new systems with a good inverter 10 to 12 % is realistic.
- Mounting position: “Building integrated” (roof-parallel, warmer) or “Free-standing” (ventilated, 2 to 3 % more).
- Slope and azimuth: slope in degrees (pitched roofs mostly 30 to 45°). Azimuth in the PVGIS convention: 0 = south, −90 = east, 90 = west. A compass azimuth of 150° (south-south-east) is −30 in PVGIS.
- Horizon: by default PVGIS computes the terrain horizon from the 90 m model. Alternatively upload your own file (see below).
- Visualise or download CSV/JSON. The result shows annual and monthly yield, irradiance and year-to-year variability.
The horizon file
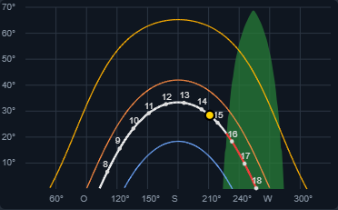
PVGIS accepts a text file with elevation angles in degrees, clockwise from north, evenly spaced over 360°. 36 values mean 10° steps, 360 values 1° steps. Example for 8 directions: 0 5 20 35 30 10 5 0, a high mountain to the south (values 3 to 5 stand for east to west). Everything below that line counts as blocked: PVGIS then removes the direct irradiance from those directions, diffuse light remains.
That is how you get trees and houses in: from the roof centre, measure the highest point of the object as an angle for each direction. By hand that is feasible for one tree, not for a whole neighbourhood. PV-Schatten does exactly this automatically: objects and laser scan are converted into a 360-value horizon line, and the button “Generate horizon for PVGIS” outputs the line to copy.
What PVGIS cannot do
- Near shading. The 90 m terrain model sees no tree, no house, no chimney. Without your own horizon file PVGIS calculates as if the system stood in an open field.
- Partial shading per module. The horizon applies to the whole system. A chimney shadow on two modules cannot be modelled; that needs a module layout with a string model.
- Snow. No snow model. At 900 m altitude 20 to 50 % of winter monthly yields are often missing.
- Self-consumption. PVGIS delivers hourly values but no household, no battery, no euros.
How PV-Schatten complements PVGIS
PV-Schatten calls PVGIS twice: once with the terrain horizon, once with the horizon from laser scan and objects. The difference is the loss from shading in kWh and euros. Plus snow estimate by altitude and tilt, hourly values for self-consumption and battery, module layout with string model. All with the same PVGIS data that is in your quote, so directly comparable. The laser-scan horizon is available for Austria; shadows from objects, sun path and PVGIS yield work anywhere in Europe.