Trees, neighbouring houses, hills: the free shading calculator PV-Schatten shows you hour by hour on the aerial image where shadows fall on your roof, computes the horizon from the official laser scan and the annual yield with PVGIS. With and without shading, in kWh and euros.
Calculate for free Free, no sign-up, in the browser. Aerial image and laser scan for all of Austria; shadows and yield for all of Europe.


Everything in one tool, everything free.
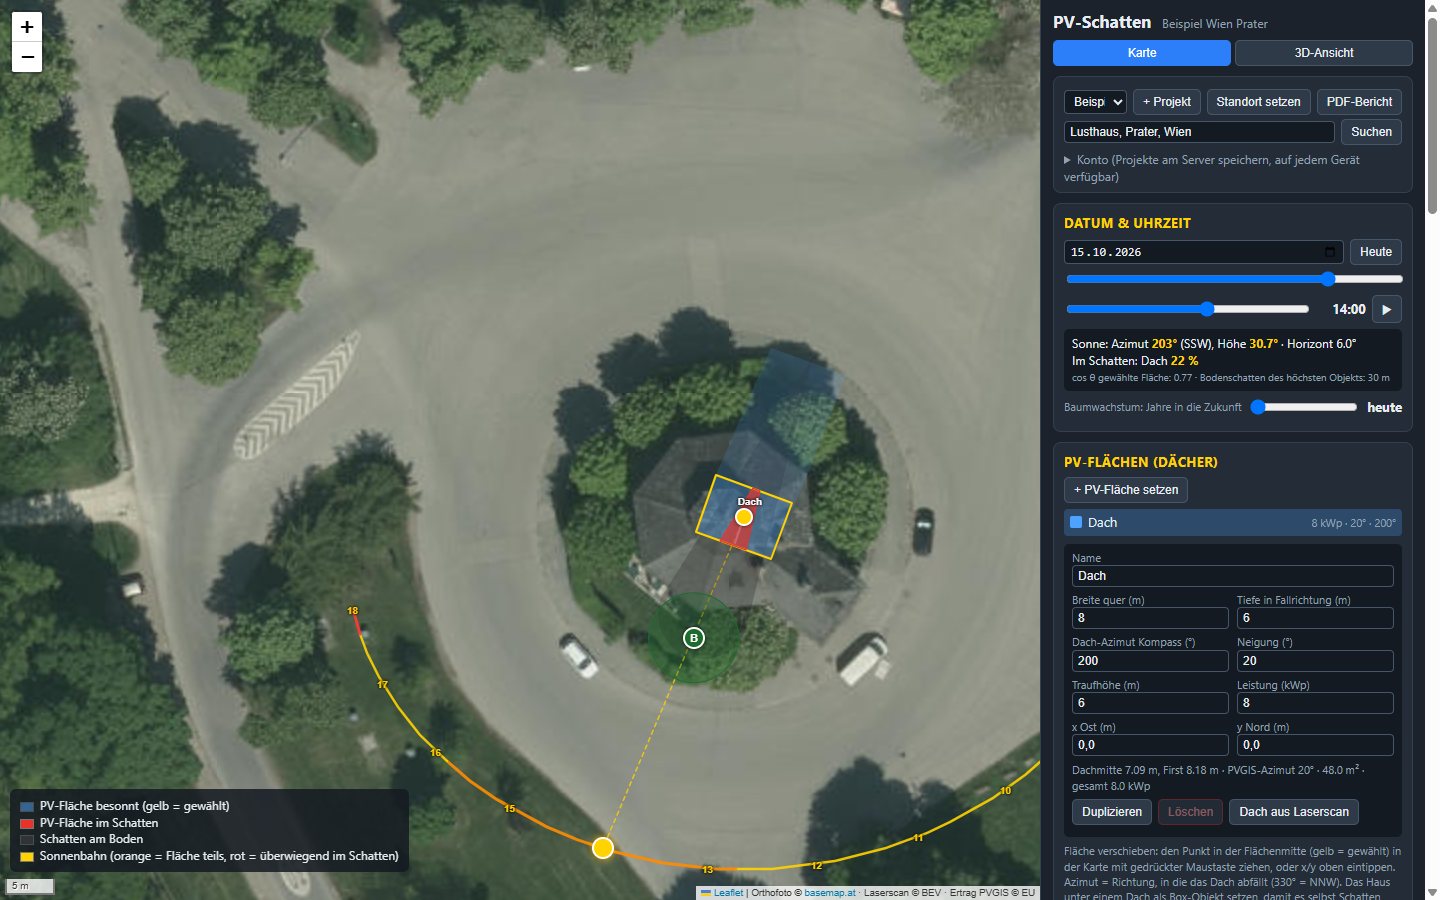
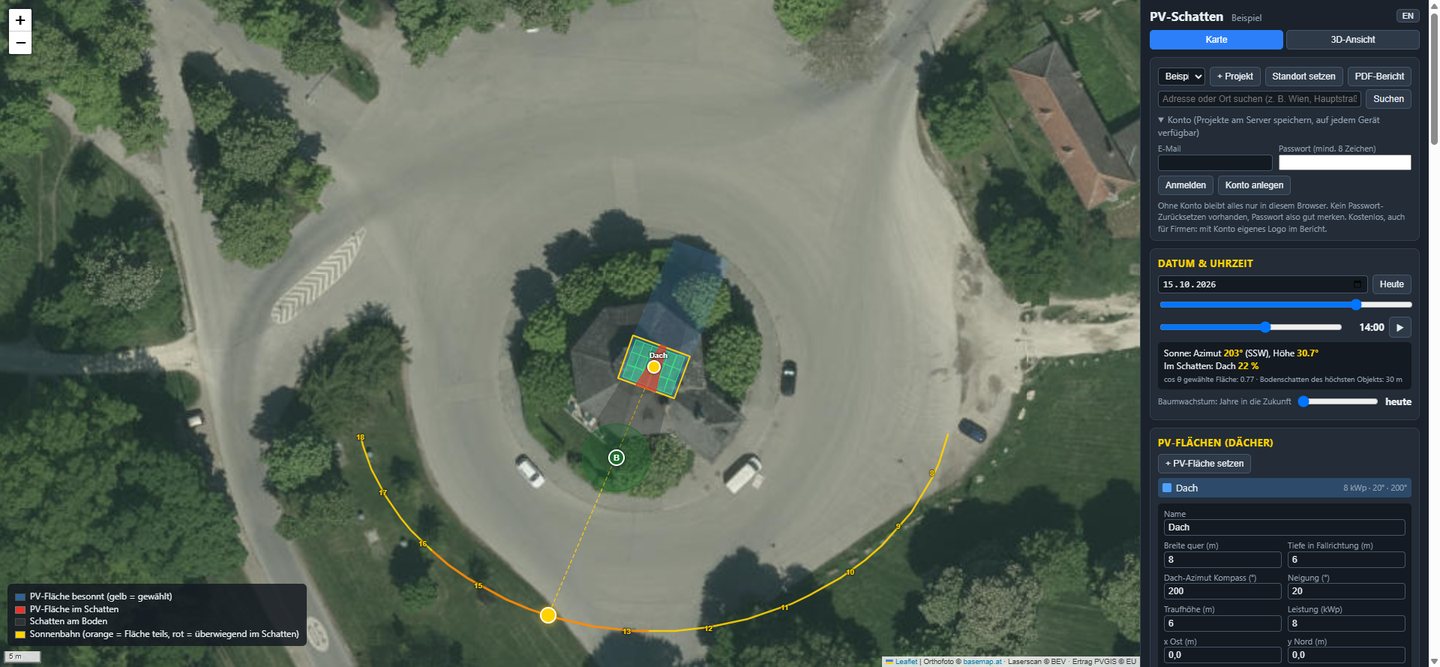
Place trees, houses and chimneys as objects, slide date and time: the shadow moves across the orthophoto and the shaded part of the PV area turns red. Trees can be grown years into the future.
The BEV surface model with 1 m resolution knows every tree and every roof around you. PV-Schatten traces rays from your roof in all directions up to 2 km and builds the real horizon from them, automatically for all of Austria.
The horizon from objects and laser scan goes straight into the PVGIS calculation of the European Commission. You see the annual and monthly yield without shading, with shading, and the loss in kWh and euros.
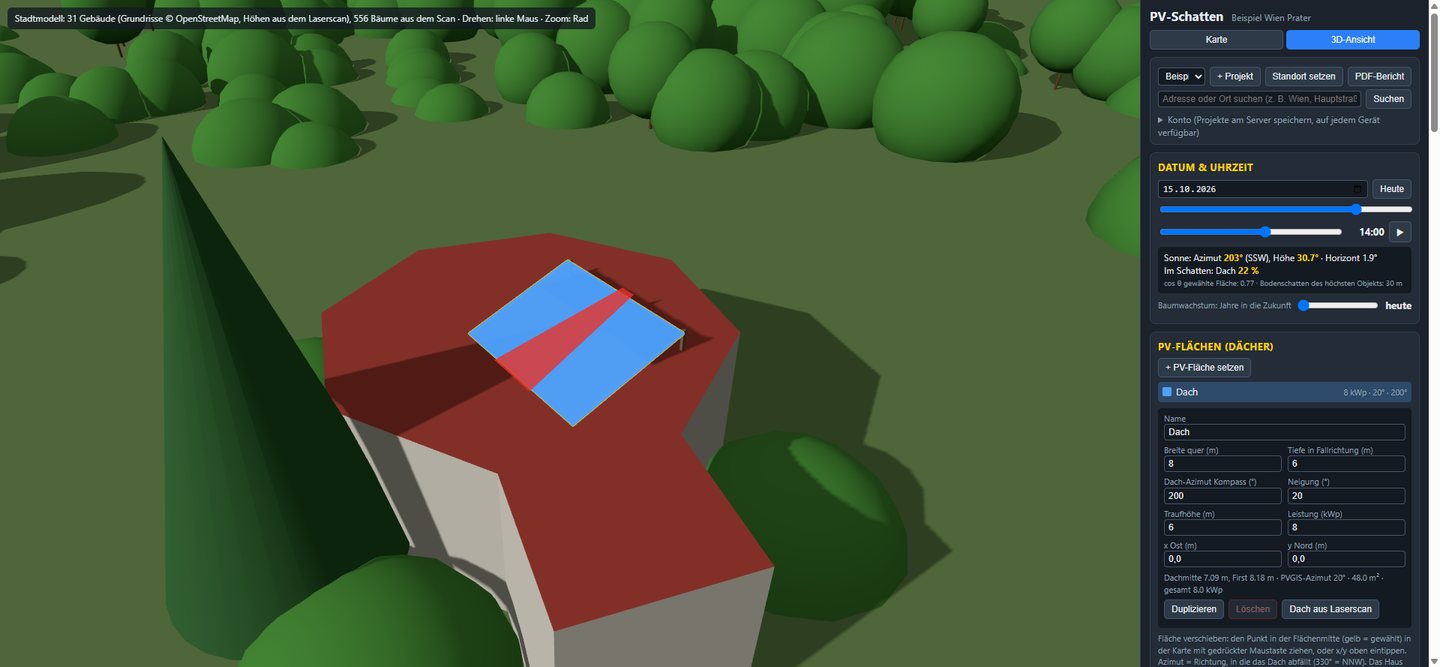
Terrain from the laser scan, buildings from OpenStreetMap with measured heights, trees from the scan, sun path and shadows in 3D. Rotate, zoom, play the day.
Hourly profile from PVGIS against your load profile with heat pump and EV, batteries from 2 to 20 kWh compared, payback and levelised cost of electricity. Save and compare variants.
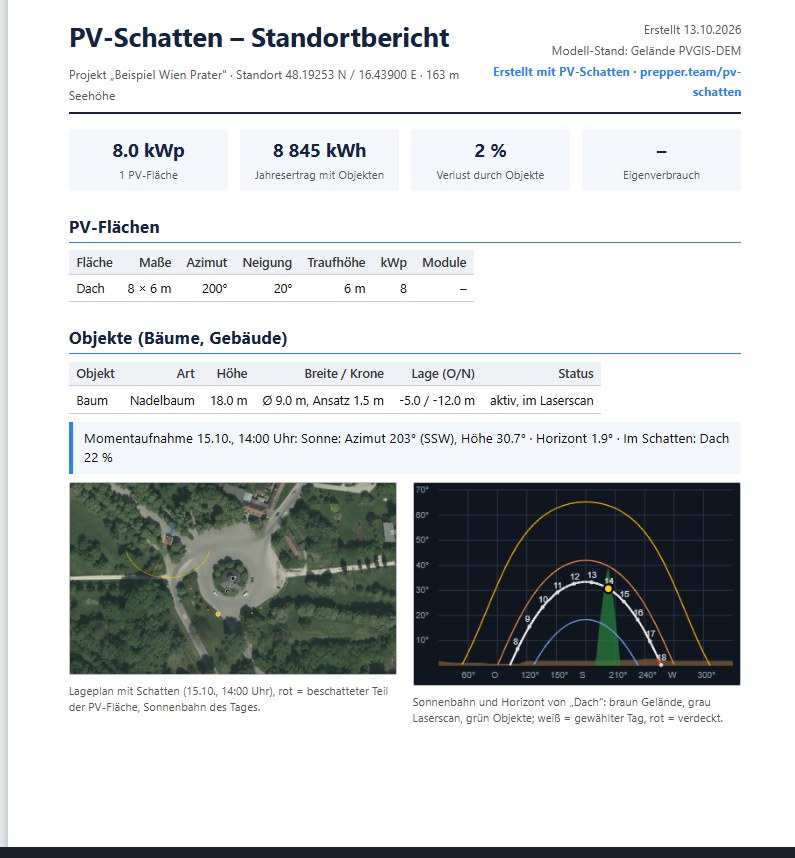
Site plan with shadows, sun-path diagram, shaded hours per month, yield tables, self-consumption, 3D image. Installers and energy consultants put their logo and company details in the header.
Three steps, five minutes.
Type an address or click the map. The aerial image from basemap.at appears, the laser-scan window loads in the background.
Draw the PV area, enter tilt and orientation or press “Roof from laser scan”. Add trees and houses that are not in the scan yet, for example a planned new building.
Shaded hours per month, yield with and without objects, self-consumption and economics. Save as a PDF report or pass it on to your installer.


Is the carport roof behind the spruce worth it? East or west side? Battery or not? Numbers instead of gut feeling, before the quote is signed.
Prove shading at the customer's place in minutes, compare variants, put a report with your own logo in the quote folder. Projects per customer on the server, from any device.
Compare actual monthly yields against the expectation, grow trees into the future, see whether the neighbour's tree is already costing you yield.
Official and open data, named openly.
| Aerial image | Orthophoto from basemap.at (Austrian administrative base map, CC BY 4.0), resolution down to 20 cm. |
|---|---|
| Laser scan | Surface model ALS-DSM 1 m of the Austrian Federal Office of Metrology and Surveying (BEV, CC BY 4.0), flown 2022 to 2024. Contains buildings and trees with their heights. |
| Yield | PVGIS 5.3 of the European Commission (Joint Research Centre), irradiance database SARAH3 2005 to 2023, hourly values of 2019 for self-consumption. |
| Sun position | Astronomical calculation (SunCalc algorithm), accuracy better than 0.5°. |
| Buildings 3D | Footprints from OpenStreetMap (ODbL), heights from the laser scan. |
| Limits | Aerial image and laser scan only in Austria; elsewhere place trees and houses by hand. Trees in the scan are as tall as at the time of the flight. Snow is an estimate by altitude and roof tilt. All results are model calculations to support decisions, not a guarantee of yields. |
Nothing. All features are free, including the PDF report and your own logo on the report. An account is optional and only serves to use projects on several devices.
Shadows, sun path and PVGIS yield work all over Europe. The aerial image and the automatic horizon from the laser scan are available for Austria. Outside Austria you place trees and houses by hand; the terrain horizon then comes from PVGIS.
The sun position is astronomically exact. The laser scan has 1 m resolution; trees may have grown since the flight, which is what the tree-growth slider is for. The yield comes from PVGIS with 19 years of satellite data. Results are model calculations to support a decision, not a yield guarantee.
No. Without an account everything stays stored in your browser. With an account (e-mail and password) the projects are stored on a server in Germany and reachable from any device. There is no password reset at the moment, so remember your password.
PVGIS computes the yield but knows nothing about trees and neighbouring houses. Shadowmap shows shadows but does not compute PV yield. PV-Schatten combines both: objects and laser scan are converted into a horizon and fed straight into the PVGIS calculation, as a comparison with and without shading in kWh and euros.
Yes. The report is a normal PDF with site plan, sun path, shaded hours per month, yield with and without objects, self-consumption and economics. The other way round, installers can create it with their own logo for their customers.
From five points of the PV area, rays are traced over the surface model in 1° steps up to 1.9 km. The highest angle in each direction gives the horizon line. Trees and houses you place yourself as objects are added analytically; to avoid double counting you can mark each object as already contained in the scan.
A tree's shadow rarely covers the whole area. PV-Schatten clips the shadow polygon with the roof area and reports the shaded share. In the module layout you also see which modules are affected and what a string layout costs compared with optimisers.
With real figures from PV-Schatten and PVGIS.
How much yield a spruce or broadleaf tree costs by height, distance and direction, month by month, and when felling pays off.
Why a chimney shadow slows the whole string and when power optimisers pay off.
PVGIS values for seven Austrian cities and why east-west often wins on self-consumption.
Calculate yield, enter a horizon file, and where PVGIS falls short on near shading.
Free, no sign-up, in five minutes. Works on PC, tablet and phone. Interface in English and German.
Open PV-Schatten